开篇概述
在上篇博客中详解Google Chrome浏览器(理论篇)一文中,主要讲解了Chrome 搜索引擎使用、Chrome安装和基本操作、Chrome 基本架构、多线程等原理性问题,这篇将重点讲解Chro-me实操问题,主要结合“Chrome 主调试面板“,对Chrome,Elements,Con-sole,Sources,NetWork,TimeLine,Profiles,Application,Security,Audits进行详解。若对广大读者朋友有所帮助,我将不胜感激。本篇博文主要从 当然了,在阅读本篇文章前,强烈建议大家先阅读详解Google Chrome浏览器(理论篇)一文。如此,对本篇文章的理解,也许会更加容易些。
温故而知新
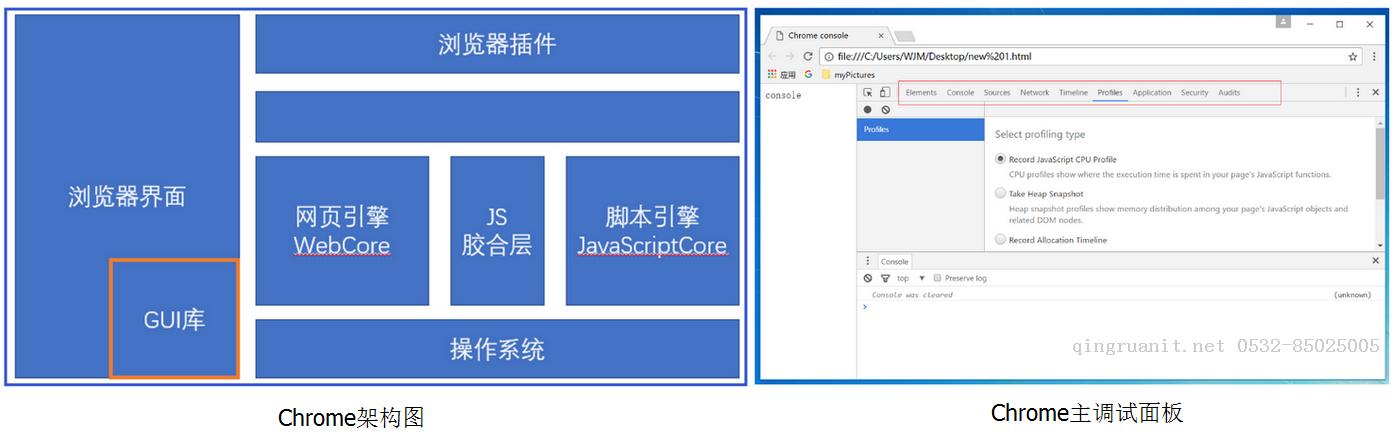
1、Chrome基本架构图和Chrome主调试面板
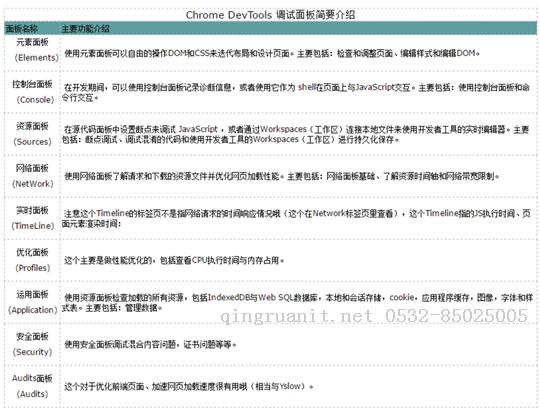
2、Chrome DevTools 调试面板简要介绍
正文
一、Elements面板
概述
定义: Inspect and Edit Pages and Styles by Elements panel,but also effective immediately.
译文:通过Elements 面板,不仅仅可以查看和编辑页面和样式,而且所做的改变立即生效。

详解
第一部份:操作DOM
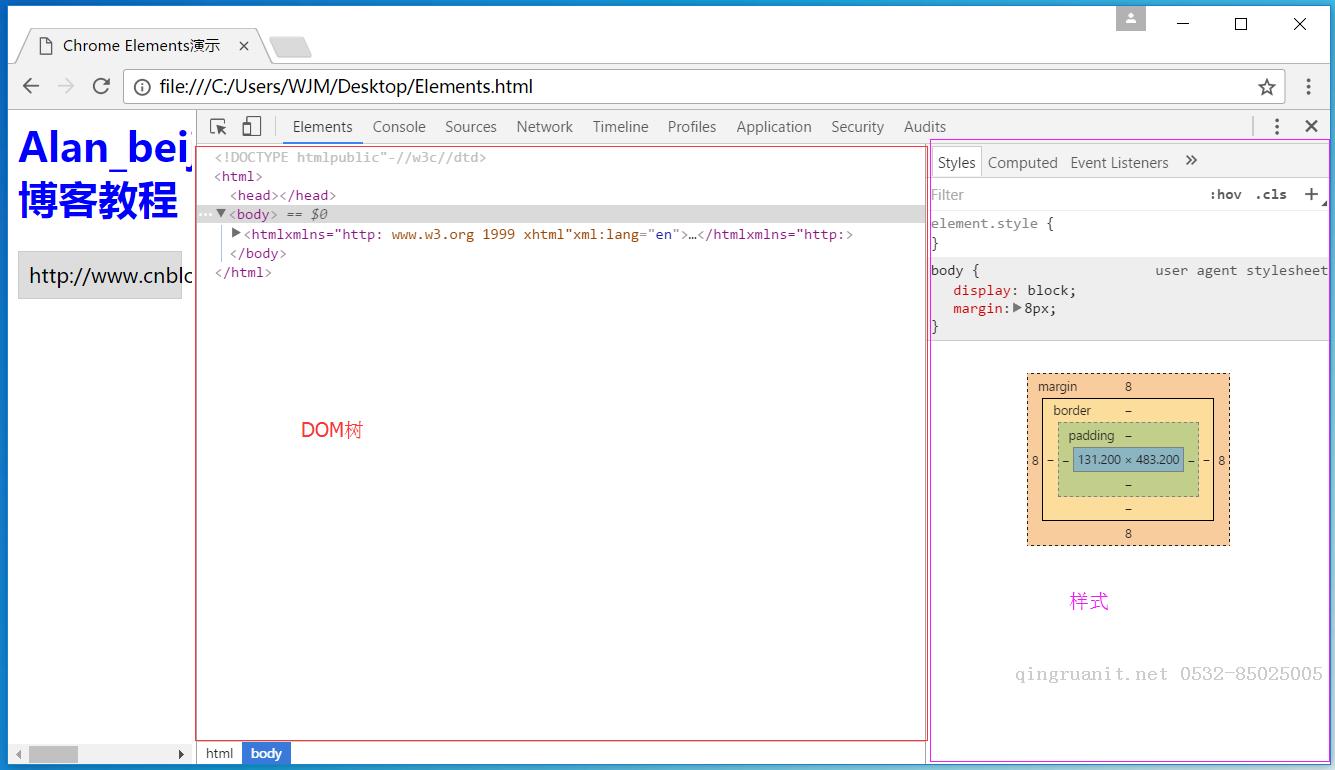
1、查看DOM树
打开Element面板,可以查看所有DOM节点,包括CSS和JavaScript,如下图所示,左侧为DOM树,右侧为CSS样式。
2、选取DOM节点
将鼠标移到网页中的某元素上面,该元素会发生变化如下图所示:
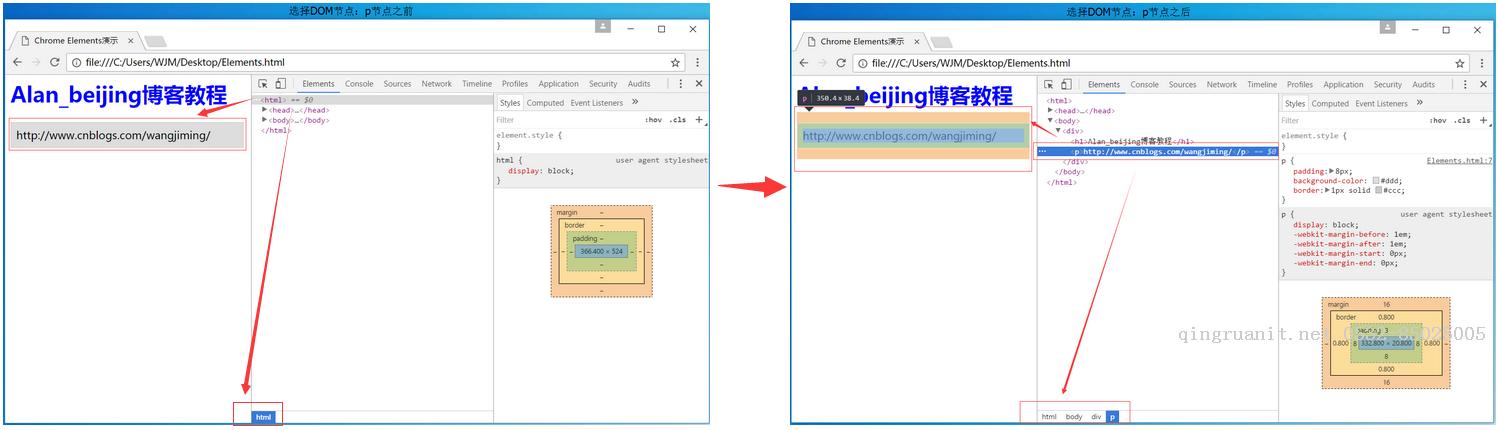
3、点击DOM树p节点元素,即可选中。这时,会发现Element面板中的DOM树发生了变化,如下图所示:
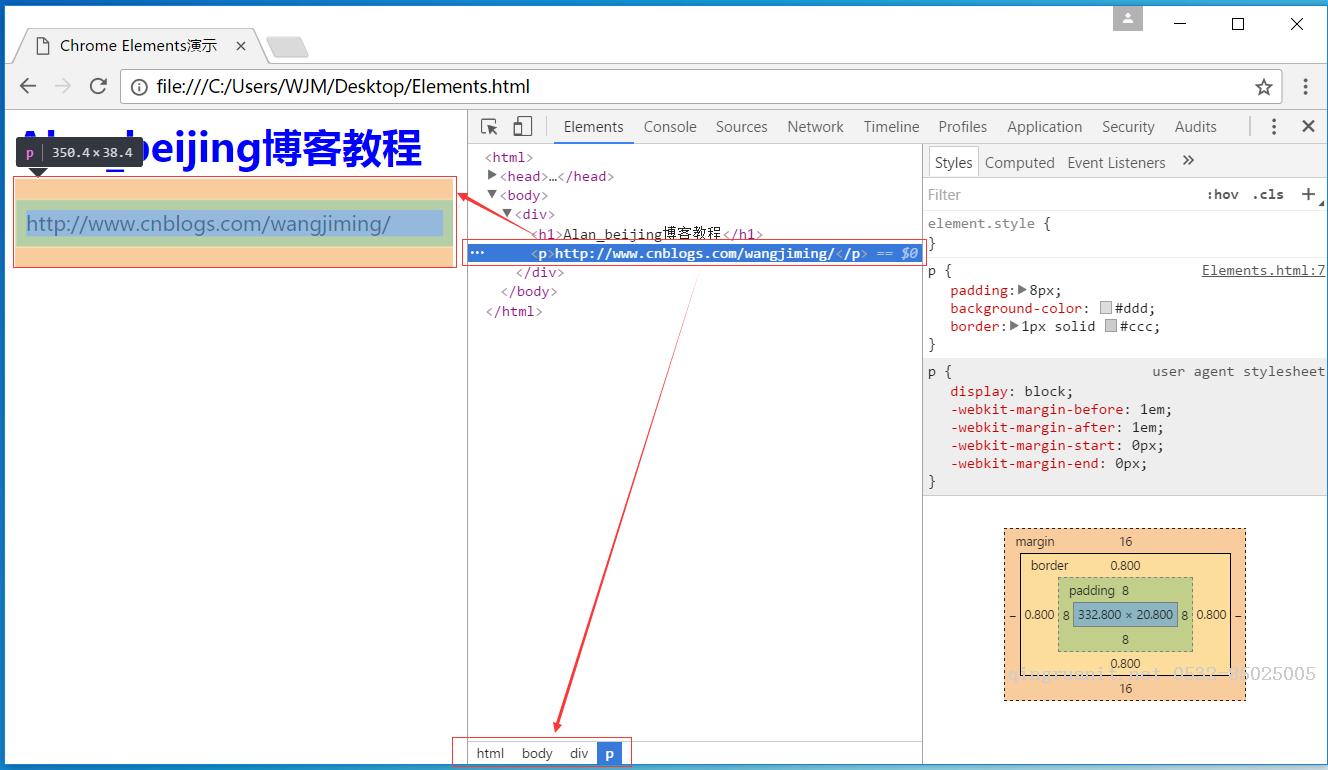
注释:
选中的p节点在DOM树中被精确定位(蓝色背景),可以看到p节点的DOM层次(红色方框),在面板右侧,是p节点的CSS样式。当然,也可以在Element面板的DOM树中选取DOM节点。将鼠标放到相应的DOM节点上,会发现网页中相应的节点也发生了变化,点击该节点,即可选中。
4、增加、删除和修改DOM节点
在Element面板中,选择DOM节点,在文本处右击鼠标,会弹出一个菜单,如下图所示:
注释
a、Edit text:编辑该节点中的文本。也可以在文本处双击进行编辑。
b、Edit as HTML:编辑该节点及其子节点的所有HTML元素(包括节点中的文本)。
c、Copy:复制 。(比较简单,这里就不论述了)
(1)Copy outerHTML
(2)Copy selector
(3)Copy XPath
(4)cut element
(5)Copy element
(6)Paste element
d、Hide element:隐藏元素,让其不在页面显示。
e、Delete element:删除元素。
f、Expand all:展开指定节点及其所有子节点。
g、Collapse all:收缩指定节点及其所有子节点。
5、拖动节点,改变节点顺序。
6、为节点添加属性
为<p>节点添加id属性,如下:
1 | <pid="demo">http://www.itxueyuan.org/javascript/</p> |
会在控制台输出p#demo;再向<p>节点添加class属性和name属性,如下:
1 | <pid="demo"class="demo"data="demo">http://www.itxueyuan.org/javascript/</p> |
会在控制台输出p#demo.demo。可见,控制台只会输出符合W3C标准的属性,不支持自定义属性。不过,实际开发中很少用到该功能。
7、Inspect and live-edit the HTML and CSS of a page using the Chrome DevTools Elements panel.
注释
a、Inspect and edit on the fly any element in the DOM tree in the Elements panel.
b、 View and change the CSS rules applied to any selected element in the Styles pane.
c、View and edit a selected element's box model in the Computed pane.
d、View any changes made to your page locally in the Sources panel.
8、Live-edit a DOM node
To live-edit a DOM node, simply double-click a selected element and make changes:
注释
The DOM tree view shows the current state of the tree; it may not match the HTML that was originally loaded for different reasons. For example, you can modify the DOM tree using JavaScript; the browser engine can try to correct invalid author markup and produce an unexpected DOM.
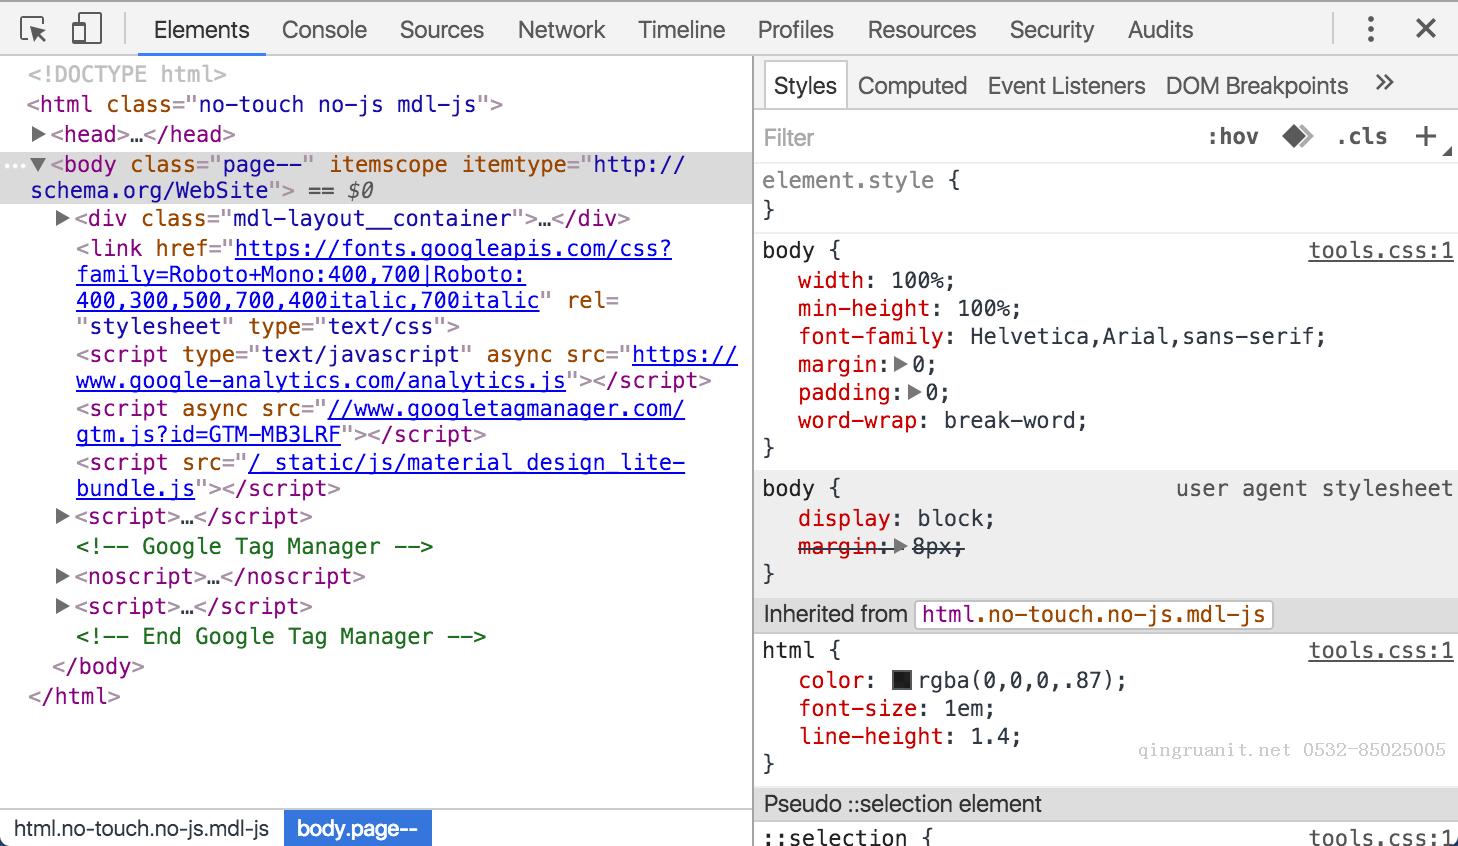
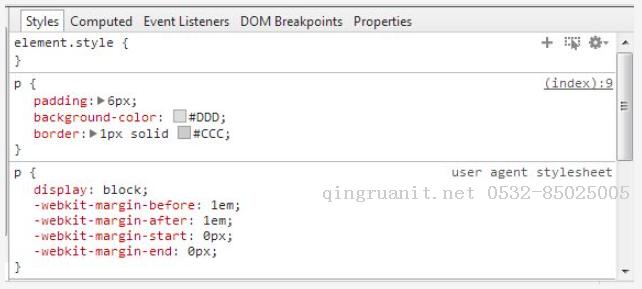
9、Live-edit a style
Live-edit style property names and values in the Styles pane. All styles are editable, except the ones that are greyed out (as is the case with user agent stylesheets).
To edit a name or value, click on it, make your changes, and press Tab or Enter to save the change.
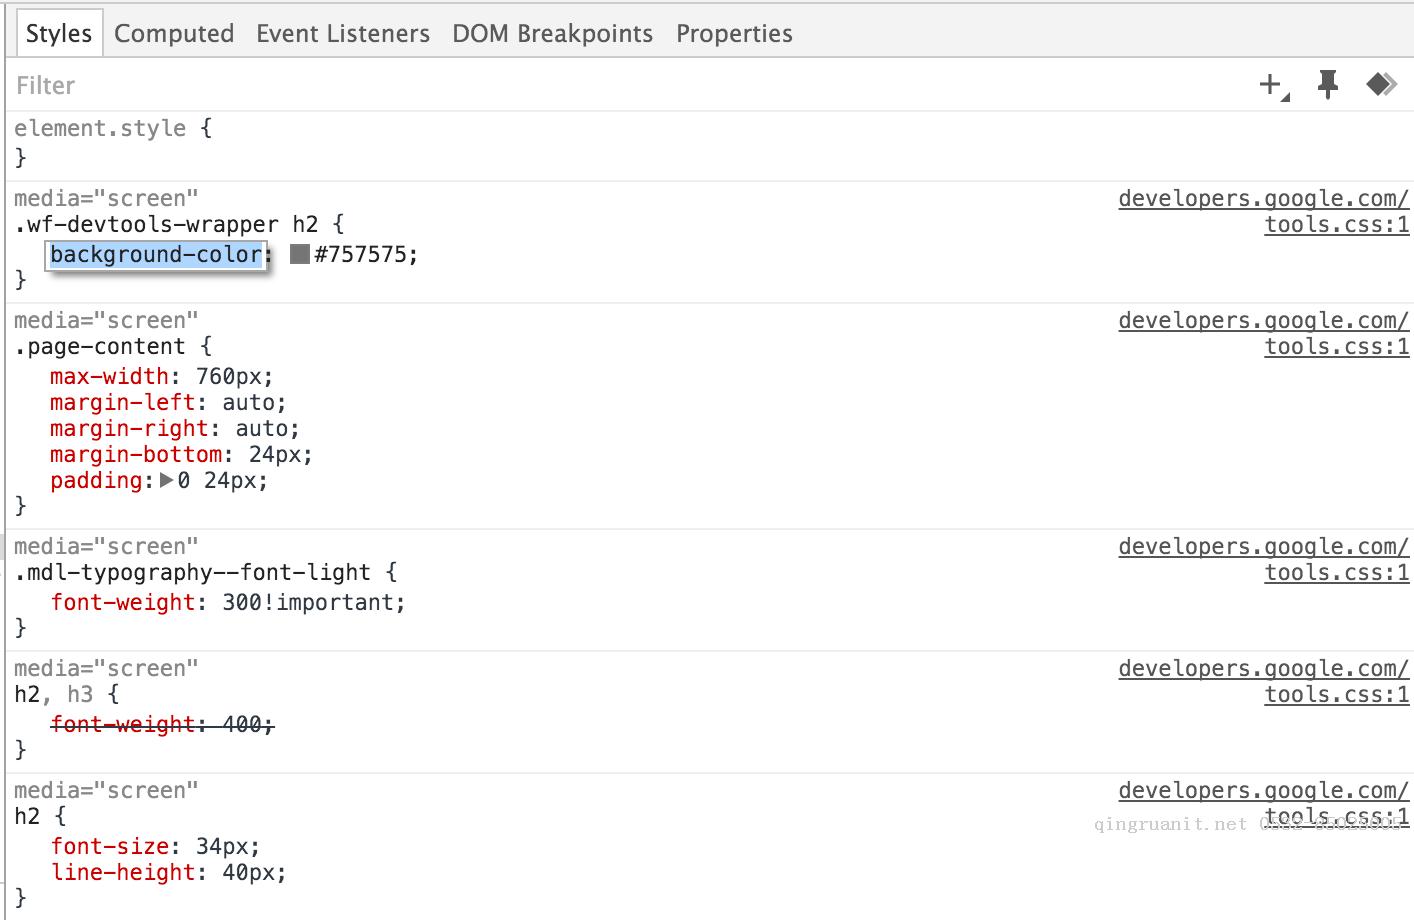
By default, your CSS modifications are not permanent, changes are lost when you reload the page. Set up persistent authoring if you want to persist your changes between page loads.
10、Examine and edit box model parameters
Examine and edit the current element's box model parameters using the Computed pane. All values in the box model are editable, just click on them.
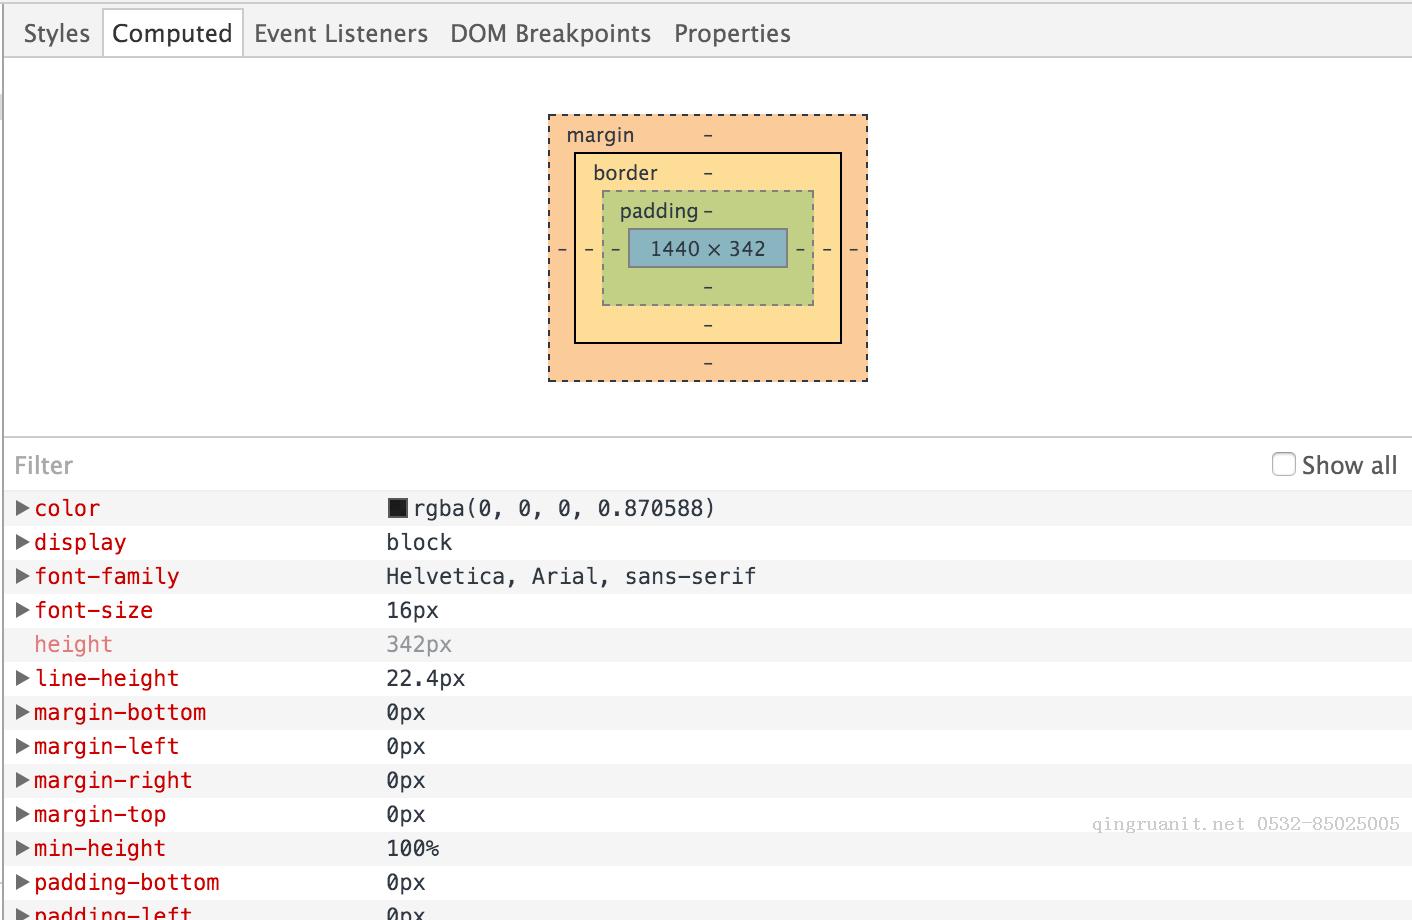
注释
The concentric rectangles contain the top, bottom, left, right values for the current element's padding, border, and marginproperties.
For non-statically positioned elements, a position rectangle is also displayed, containing the values of the top, right, bottom, and left properties.

For position: fixed and position: absolute elements, the central field contains the actual offsetWidth × offsetHeight pixel dimensions of the selected element. All values can be modified by double-clicking them, like property values in the Styles pane. The changes are not, however, guaranteed to take effect, as this is subject to the concrete element positioning specifics.

11、View local changes
注释
To view a history of live-edits made to your page:
a、In the Styles pane, click on the file that you modified. DevTools takes you to the Sources panel.
b、Right-click on the file.
c、Select Local modifications.
To explore the changes made:
a、Expand top-level file names to view the time time modification occurred a modification occurred.
b、 Expand second-level items to view a diff (before and after) corresponding to the modification. A line with a pink background signifies a removal while a line with a green background signifies an addition.
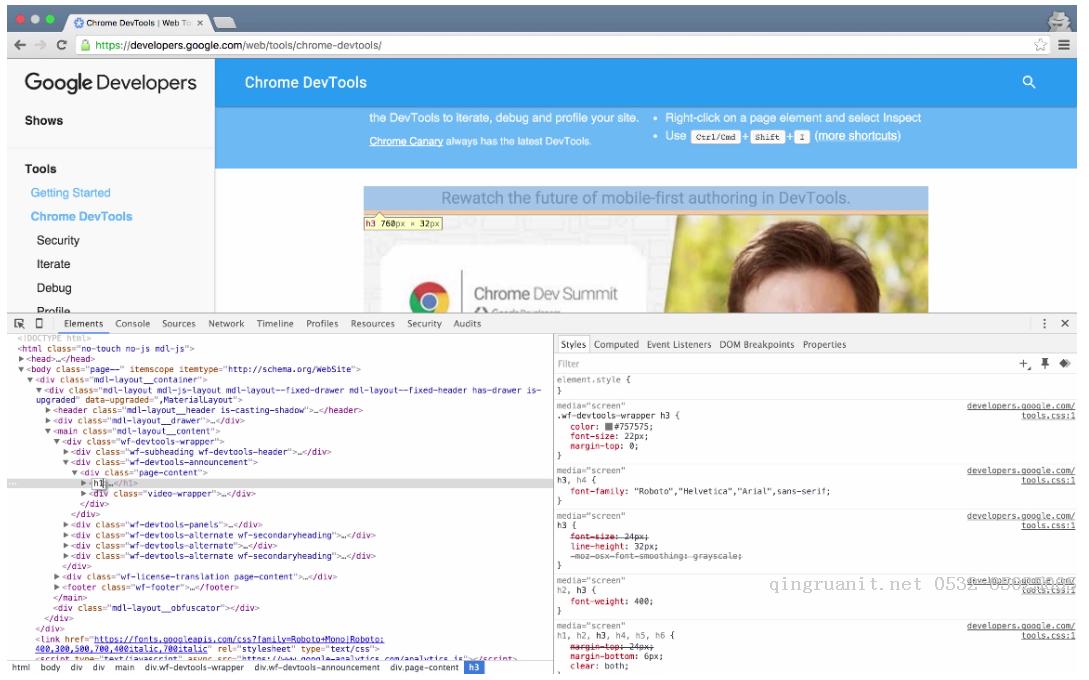
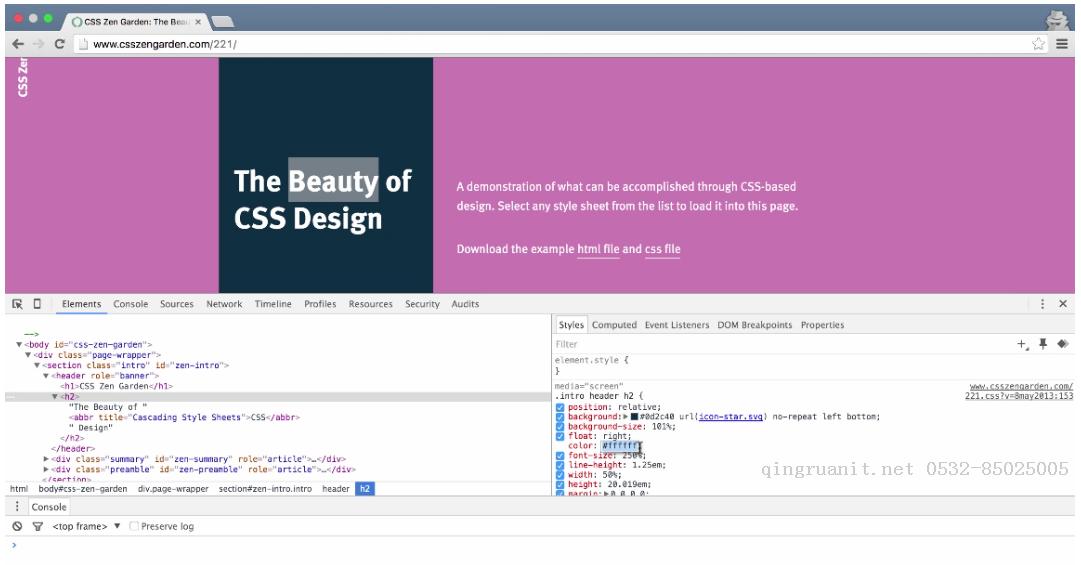
12、查看css样式
CSS样式审查面板是一个非常有用的面板,实际开发中,有时候CSS样式表会非常复杂,甚至连我们自己都不知道当前节点应用了哪些样式。使用CSS样式审查面板,可以让我们清楚地知道当前节点使用了哪些样式,分别来自哪些文件,哪些样式是被覆盖的,哪些样式是最终样式,哪些样式是无效的,等等。
如下图所示,选中节点,Element面板右侧的CSS样式审查面板会展示出该节点的CSS样式。在CSS样式审查面板中,我们可以添加、删除和修改CSS样式。另外,CSS审查面板中有几个子面板,如下图所示:
注释
子面板说明:
a、Style(样式):当前节点的样式;
b、Computed(计算):查看当前节点经过计算后的样式以及盒模型数据;
c、 Event Listeners(事件监听):查看为当前节点绑定的事件和事件监听函数;
d、 DOM Breakpoints(DOM断点):查看为当前节点设置的DOM断点;
e、 Properties(属性):当前节点(对象)的所有属性。
小结
Element 译为“元素”,Element 面板可以让我们动态查看和编辑DOM节点和CSS样式表,并且立即生效,避免了频繁切换浏览器和编辑器的麻烦。 我们可以使用Element面板来查看源代码,它不但可以很好的格式化DOM节点,清晰的展现HTML文档,还可以查看JavaScript创建的DOM节点和iframe中的DOM节点,比在当前网页中右击鼠标选择“查看网页源代码”强大很多。 总之,Element面板可以让我们很透彻的了解DOM和CSS的底层结构。
二、Console面板
概述
定义:Use the Console API to write information to the console, create JavaScript profiles, and start a debugging session.
译文:使用Console API向控制台输出信息,产生JavaScript文件和启动调试会话。
The Console
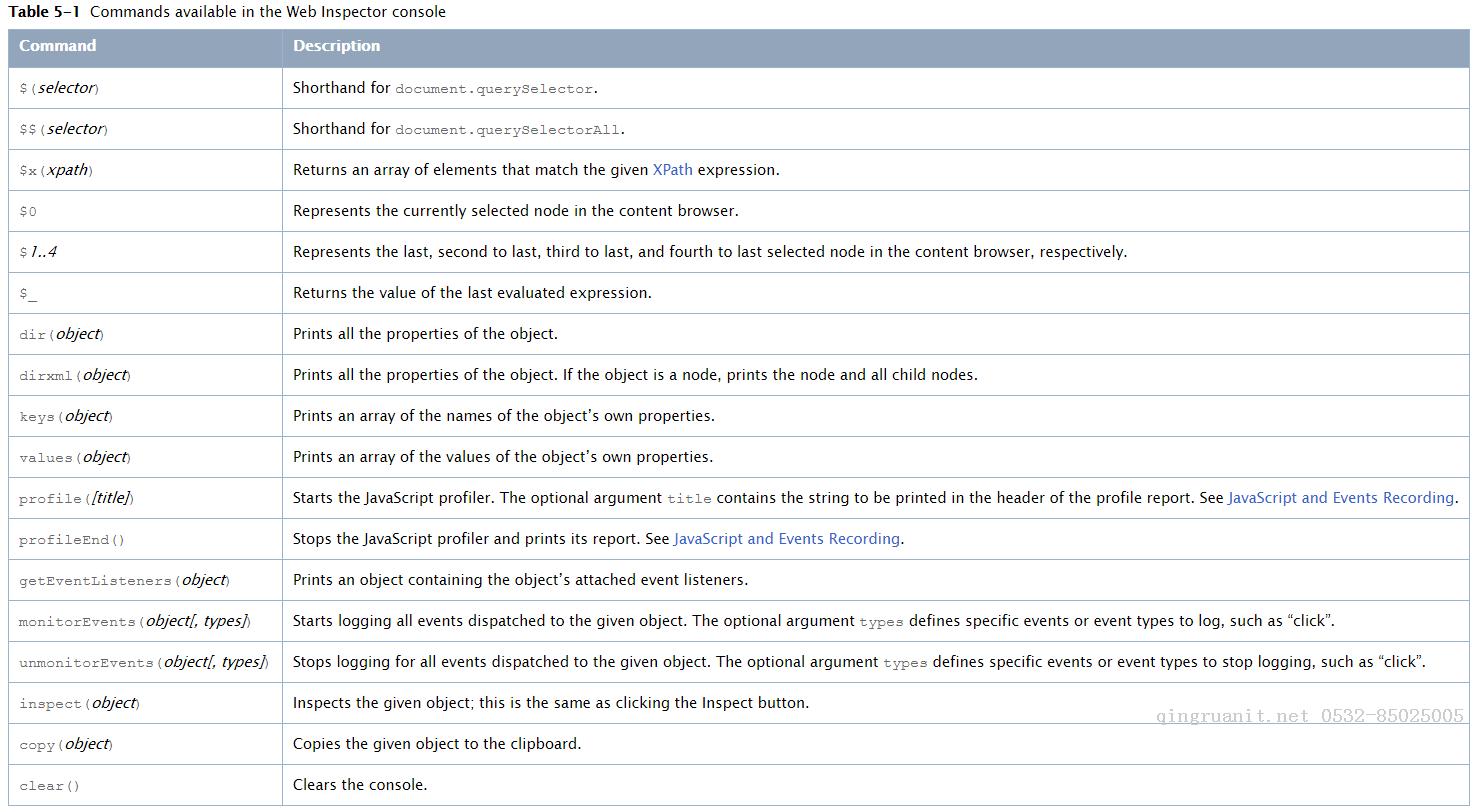
The console offers a way to inspect and debug your webpages. Think of it as the Terminal of your web content. The console has access to the DOM and JavaScript of the open page. Use the console as a tool to modify your web content via interactive commands and as a teaching aid to expand your knowledge of JavaScript. Because an object’s methods and properties autocomplete as you type, you can see all available functions that are valid in Safari.For example, open the console and type
(‘p′)[1].(
is shorthand for document.querySelectorAll—see more shorthand commands in Table 5-1.) Because this paragraph is the second instance of the p element on this page ([1] in a 0-based index), the node represents this paragraph. As you hover over the node, its position on the page is visibly highlighted. You can expand the node to see its contents, and even press Command-C to copy it to your clipboard.
Command-Line API
You can inspect HTML nodes and JavaScript objects in more detail by using the console commands listed in Table 5-1. Type the command-line APIs interactively within the console.
If your scripts share the same function name as a Command-Line API function, the function in your scripts takes precedence.
The functions listed in Table 5-1 are regular JavaScript functions that are part of the Web Inspector environment. That means you can use them as you would any JavaScript function. For example, you can assign a chain of Console API commands to a variable to create a useful shorthand. Listing 5-1 shows how you can quickly see all event types attached to the selected node.

After defining this function, inspect the magnifying glass in the top-right corner of this webpage, and type evs() in the console. An array containing the string “click” is returned, because there is a click event listener attached to that element.
Of course, these functions shouldn’t be included in your website’s JavaScript files because they are not available in the browser environment. Only use these functions in the Web Inspector console. Console functions you can include in your scripts are described in Console API.
Console API

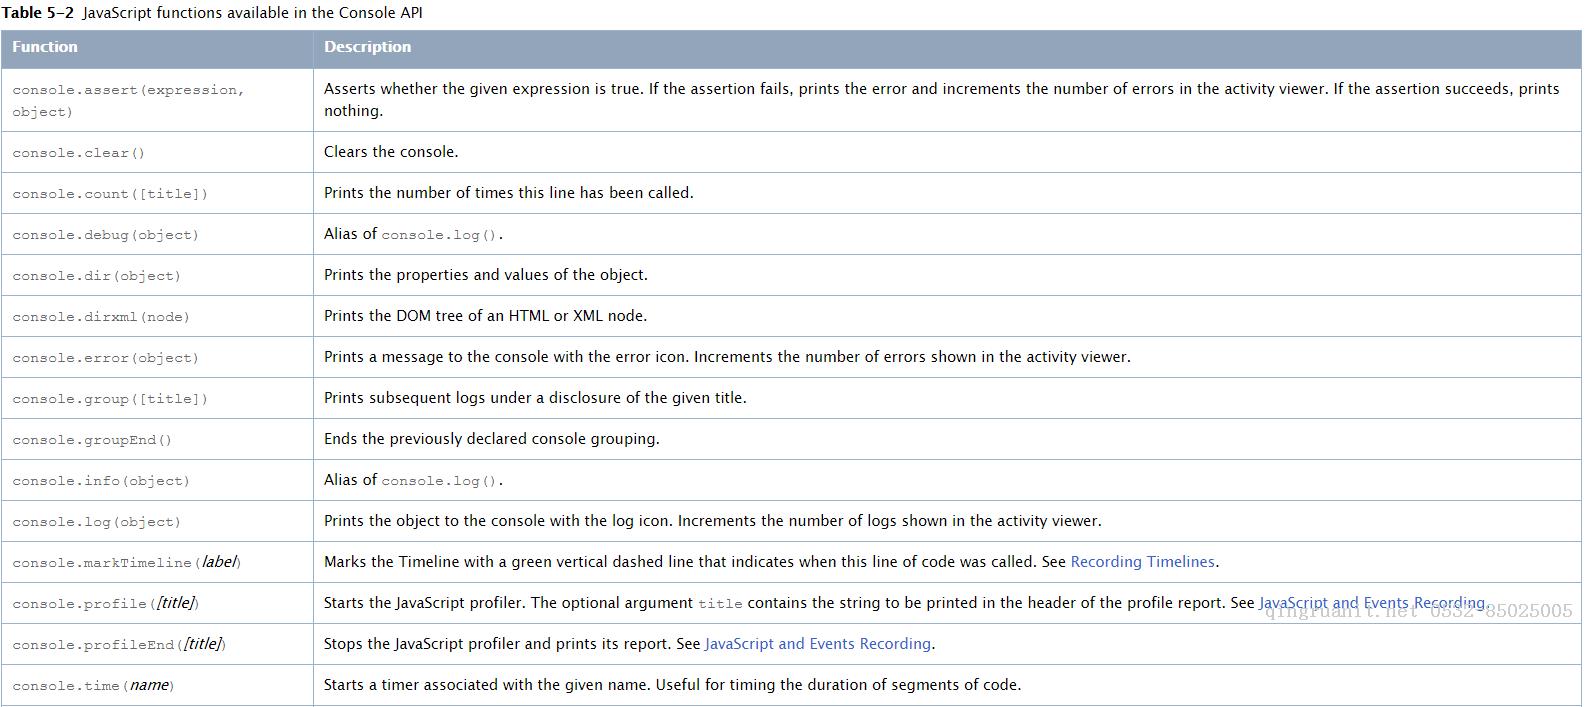
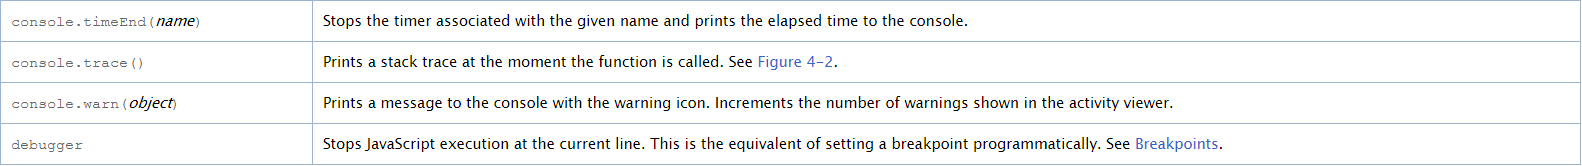
详解
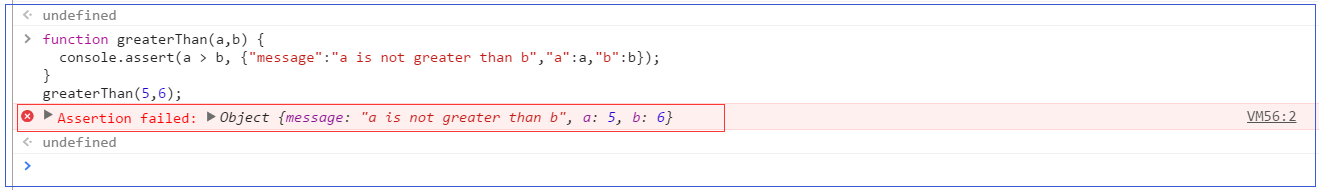
1、console.assert(expression, object)
定义:Writes an error to the console when the evaluated expression is false.
译文:当计算表达式为假时,向控制台输出错误信息。
示例1:
1 2 3 4 | function greaterThan(a,b) { console.assert(a > b, {"message":"a is not greater than b","a":a,"b":b});}greaterThan(5,6); |
result:
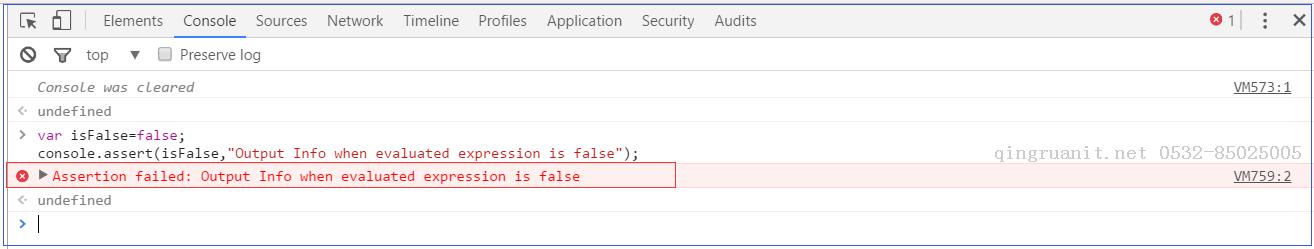
示例2:
1 2 | var isFalse=false;console.assert(isFalse,"Output Info when evaluated expression is false"); |
result:
2、console.clear()
定义:Clears the console.If the Preserve log checkbox is enabled, console.clear() is disabled. However, pressing the clear console button () or typing the shortcut Ctrl+L while the Console is in focus still works.See Clearing the console for more information.
译文:清楚控制台信息。如果保护日志复选框被启用,则console.clear()被禁用。然而,当控制台的焦点仍在工作时,按明确的控制台按钮(明确控制台按钮)或输入快捷键Ctrl + L。
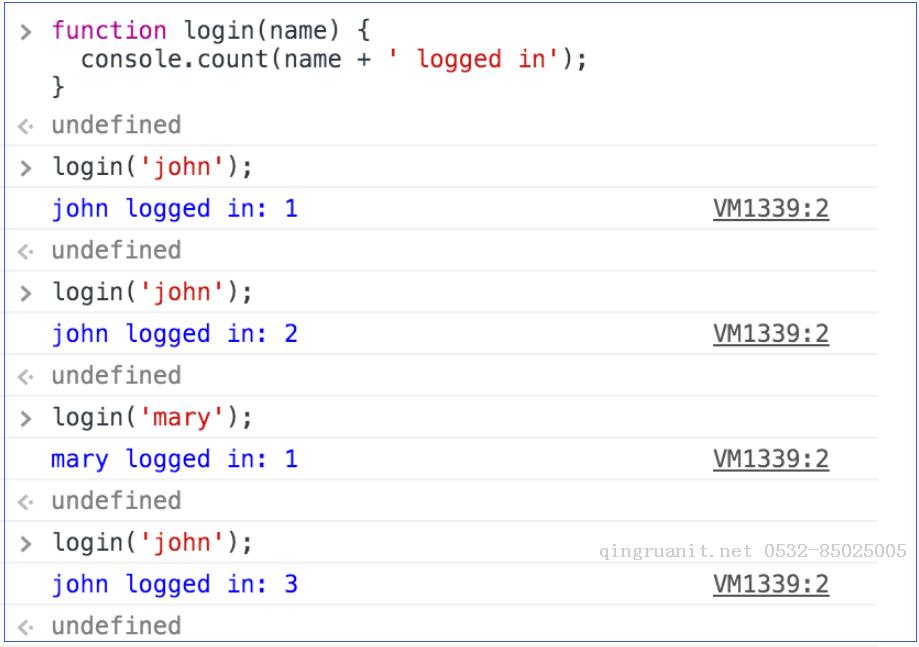
3、console.count(label)
定义:Writes the the number of times that count() has been invoked at the same line and with the same label.
译文:输出被调用相同的行和相同的标签的总次数。
示例1:
1 2 3 | function login(name) { console.count(name + ' logged in');} |
result:
4、console.debug(object [, object, ...])
定义:Identical to console.log().
译文:与console.log()一样;
小结:功能与console.log()一样。
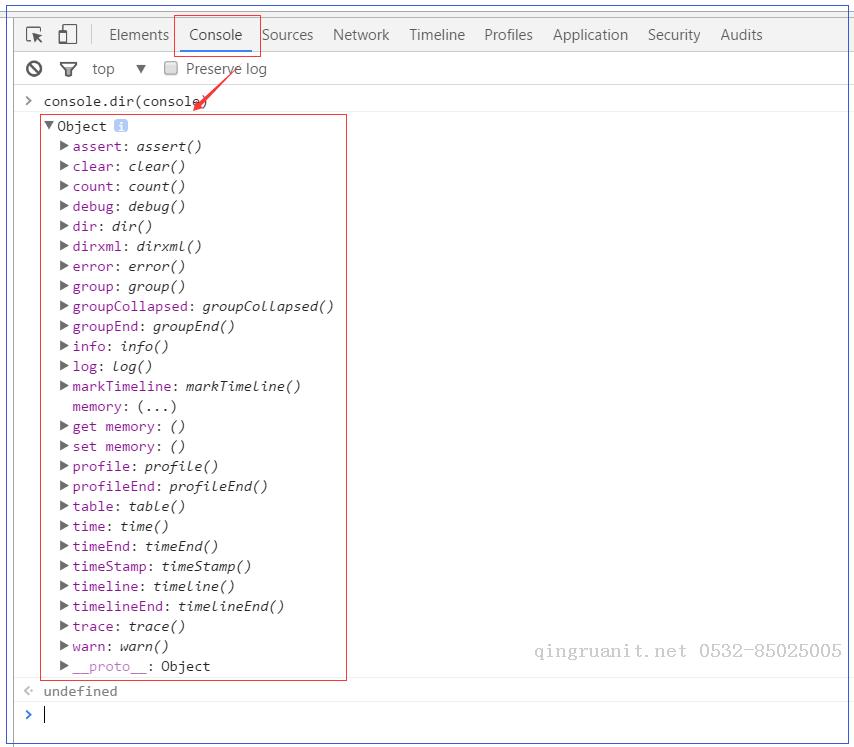
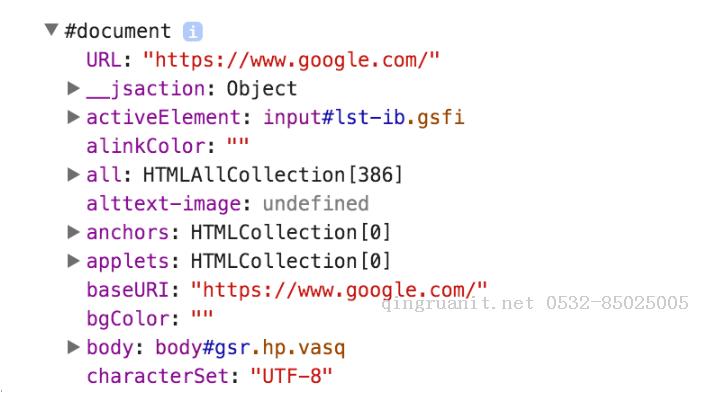
5、console.dir(object)
定义:Prints a JavaScript representation of the specified object. If the object being logged is an HTML element, then the properties of its DOM representation are printed.
译文:打印具体对象的JavaScript表示。如果被记录的对象是一个HTML元素,然后打印DOM表示的属性。
示例1:
1 | console.dir(document) |
result:
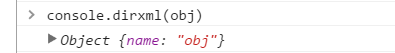
6、console.dirxml(object)
定义:Prints an XML representation of the descendant elements of object if possible, or the JavaScript representation if not. Calling console.dirxml() on HTML and XML elements is equivalent to calling console.log().
译文:如果可能,打印对象的后代元素的XML表示,如果不可能,则打印javaScript表示。对于html和xml元素,调用console.dirxml()相当于调用console.log();
示例1:
1 | console.dirxml(obj) |
result:
示例2:
1 | console.dir(document); |
result:

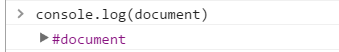
示例3:
1 | console.log(document); |
rersult:
7、console.error(object [, object, ...])
定义:Prints a message similar to console.log(), styles the message like an error, and includes a stack trace from where the method was called.
译文:打印一条类似于console.log()打印的消息,错误样式和包括堆栈跟踪。
示例1:
1 2 3 4 5 6 7 | function logName(obj){ if(obj.name==undefined){ console.error('name is undefined') }}logName({}); |
result:

示例2:
1 | console.error('print error Information'); |
result:

8、console.group(object[, object, ...])
定义:Starts a new logging group with an optional title. All console output that occurs after console.group() and before console.groupEnd() is visually grouped together.
译文:开始一个带有可选标题的日志组。所有控制台输出的内容被包含在以console.group()开始和以consol.groupEnd()结束之间。
感谢您的阅读,若有不足之处,欢迎指教,共同学习、共同进步。
博主网址:http://www.cnblogs.com/wangjiming/。
极少部分文章利用读书、参考、引用、抄袭、复制和粘贴等多种方式整合而成的,大部分为原创。
如您喜欢,麻烦推荐一下;如您有新想法,欢迎提出,邮箱:2016177728@qq.com。
可以转载该博客,但必须著名博客来源。
http://www.cnblogs.com/wangjiming/p/6359000.html